Introduction
In the realm of Microsoft Office applications, particularly in PowerPoint, the integration of visuals like SmartArt can significantly enhance the presentation of information. When it comes to transforming bullet points into engaging and informative graphics, selecting the appropriate SmartArt category is crucial. This guide explores the available SmartArt categories, highlights the one best suited for creating informational graphics out of bullet points, and provides step-by-step insights to maximize the visual impact of your presentations.
Understanding SmartArt
SmartArt in Microsoft Office allows users to create visually appealing graphics that represent information in a more dynamic and comprehensible way. The tool offers a range of categories, each designed to cater to specific types of data representation.
Available SmartArt Categories
Microsoft PowerPoint provides various SmartArt categories, such as List, Process, Cycle, Hierarchy, Relationship, Matrix, and Pyramid, among others. Each category is tailored to visually communicate different types of information, making it crucial to choose the one that aligns with the content and intent of your presentation.
Selecting the Right Category for Informational Graphics
For transforming bullet points into clear and visually engaging graphics, the “List” SmartArt category is often the most suitable choice. This category allows you to convert a simple list of items into a structured, visually appealing diagram, providing an organized and easily digestible representation of information.
Step-by-Step Guide: Enhancing Bullet Points with List SmartArt
- Open PowerPoint and Select Slide: Begin by opening Microsoft PowerPoint and selecting the slide where you have the bullet points you wish to transform.
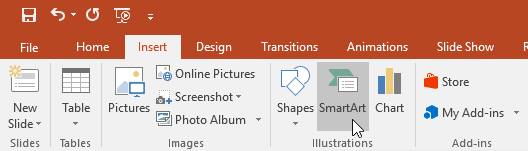
- Insert SmartArt: Navigate to the “Insert” tab and click on “SmartArt.” A gallery of SmartArt graphics will appear.
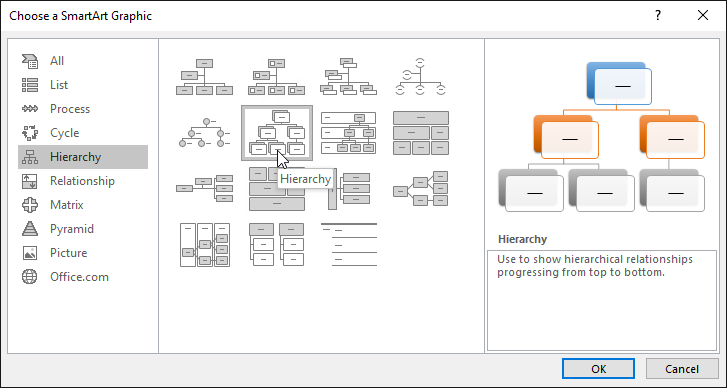
- Choose List Category: Within the SmartArt gallery, locate and choose the “List” category. This category is specifically designed for converting text into a structured, visual format.
- Enter Text: A dialogue box will appear where you can enter your bullet points. Type or copy-paste the information into the text fields provided.
- Customize and Format: Customize the List SmartArt graphic by adjusting the colors, styles, and formatting options available in the SmartArt Tools menu. This step allows you to align the visuals with your overall presentation theme.
- Add Visual Elements: Enhance the graphic further by incorporating visual elements such as icons, images, or additional shapes. This not only adds interest but also aids in conveying information more effectively.
Chart: Best SmartArt Categories for Different Data Representations:
The chart below outlines the suitability of various SmartArt categories for different types of data representation, helping users make informed choices based on their specific content and presentation goals.
To insert a SmartArt graphic:
- Select the slide where you want the SmartArt graphic to appear.
- From the Insert tab, select the SmartArt command in the Illustrations group.
- A dialog box will appear. Select a category on the left, choose the desired SmartArt graphic, then click OK.
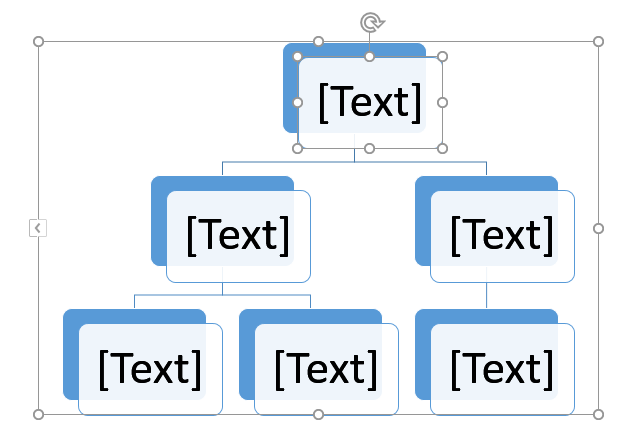
- The SmartArt graphic will appear on the current slide.
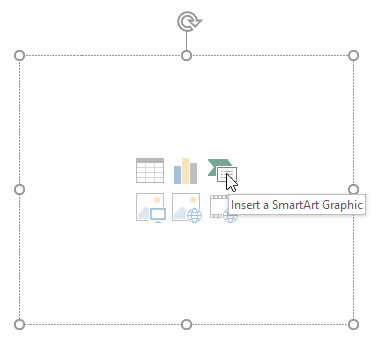
You can also click the Insert a SmartArt Graphic command in a placeholder to add SmartArt.
To add text to a SmartArt graphic:
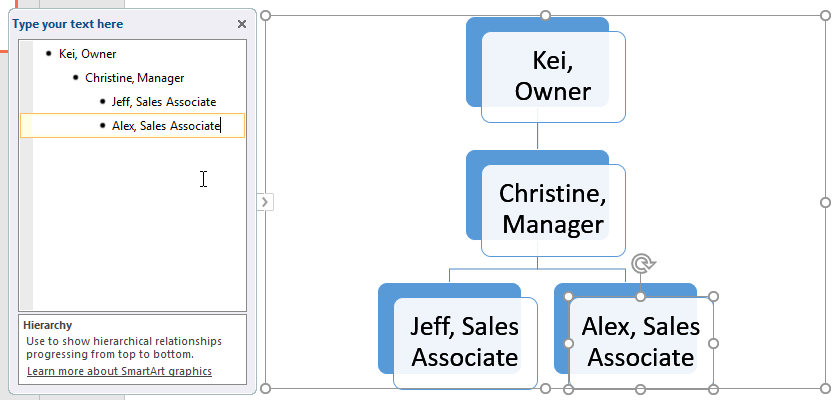
- Select the SmartArt graphic. The text pane will appear to the left.
- Enter text next to each bullet in the text pane. The text will appear in the corresponding shape. It will be resized automatically to fit inside the shape.
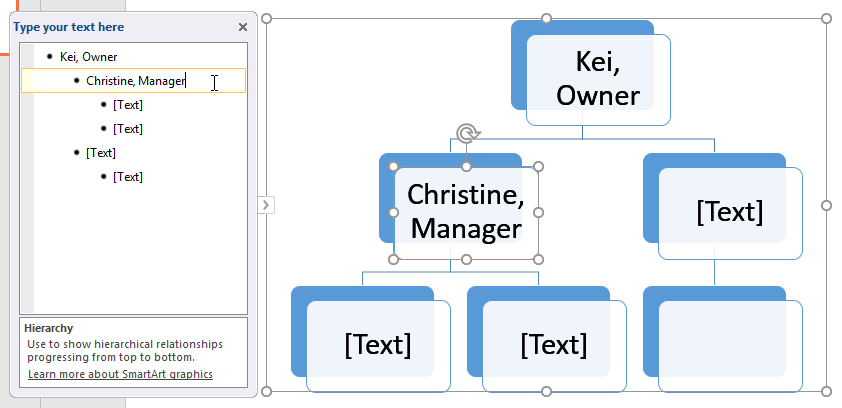
You can also add text by clicking the desired shape and then typing. This works well if you only need to add text to a few shapes. However, for more complex SmartArt graphics, working in the text pane is often quicker and easier.
To reorder, add, and delete shapes:
It’s easy to add new shapes, change their order, and even delete shapes from your SmartArt graphic. You can do all of this in the text pane, and it’s a lot like creating an outline with a multilevel list. For more information on multilevel lists, you may want to review our Lists lesson.
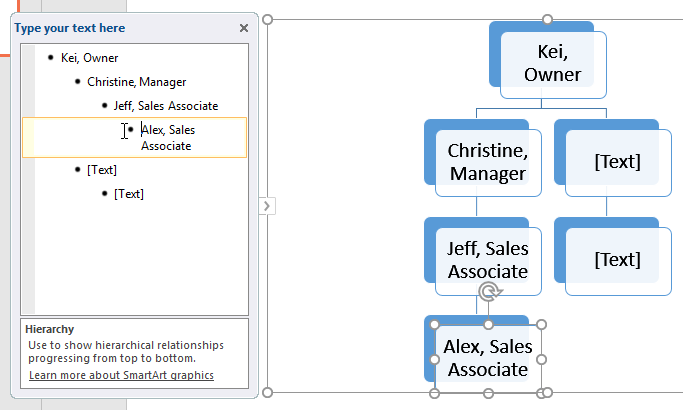
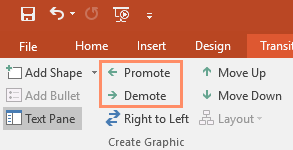
- To demote a shape, select the desired bullet, then press the Tab key. The bullet will move to the right, and the shape will move down one level.
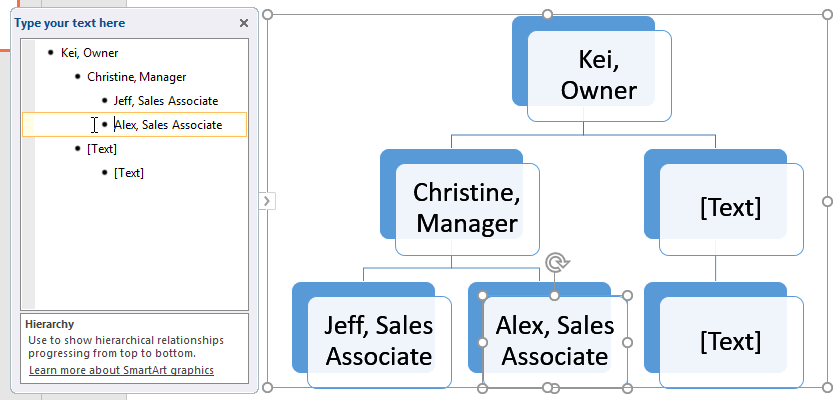
- To promote a shape, select the desired bullet, then press the Backspace key (or Shift+Tab). The bullet will move to the left, and the shape will move up one level.
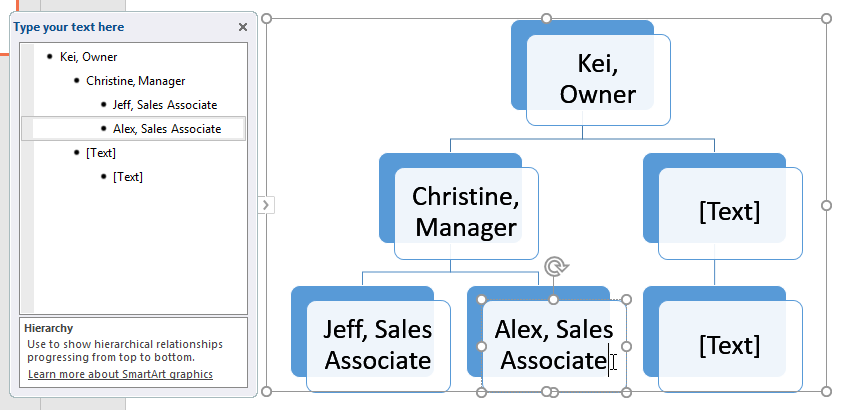
- To add a new shape, place the insertion point after the desired bullet, then press Enter. A new bullet will appear in the text pane, and a new shape will appear in the graphic.
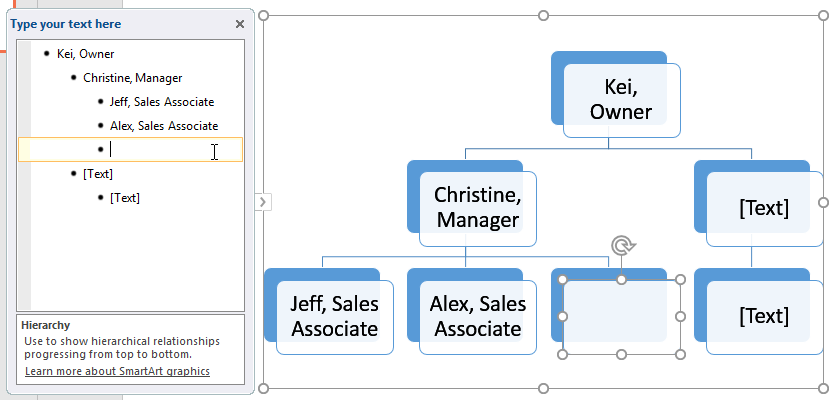
- To remove a shape, keep pressing Backspace until the bullet is deleted. The shape will then be removed. In our example, we’ll delete all of the shapes without text.
Organizing SmartArt from the Design tab
If you’d prefer not to use the text pane to organize your SmartArt, you can use the commands on the Design tab in the Create Graphic group. Just select the shape you want to modify, then choose the desired command.
- Promote and Demote: Use these commands to move a shape up or down between levels.
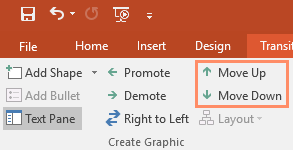
- Move Up and Move Down: Use these commands to change the order of shapes on the same level.
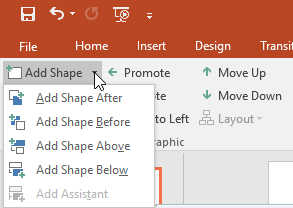
- Add Shape: Use this command to add a new shape to your graphic. You can also click the drop-down arrow for more exact placement options.
In our example, we’ve been organizing a graphic with a hierarchical layout. Not all SmartArt graphics use this type of layout, so remember that these commands may work differently (or not at all) depending on the layout of your graphic.
Customizing SmartArt
After inserting SmartArt, there are several things you might want to change about its appearance. Whenever you select a SmartArt graphic, the Design and Format tabs will appear on the right side of the Ribbon. From here, it’s easy to edit the style and layout of a SmartArt graphic.
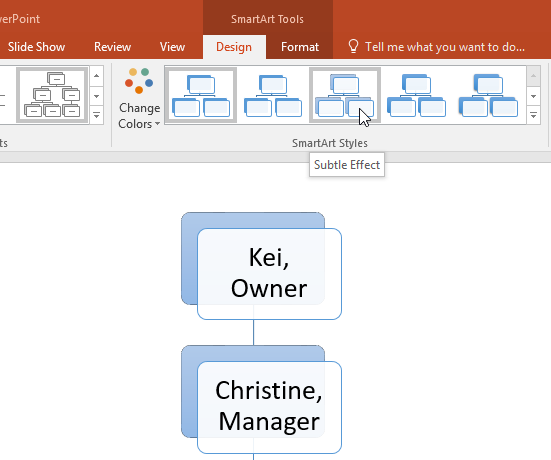
- There are several SmartArt styles, which allow you to quickly modify the look and feel of your SmartArt. To change the style, select the desired style from the SmartArt Styles group.
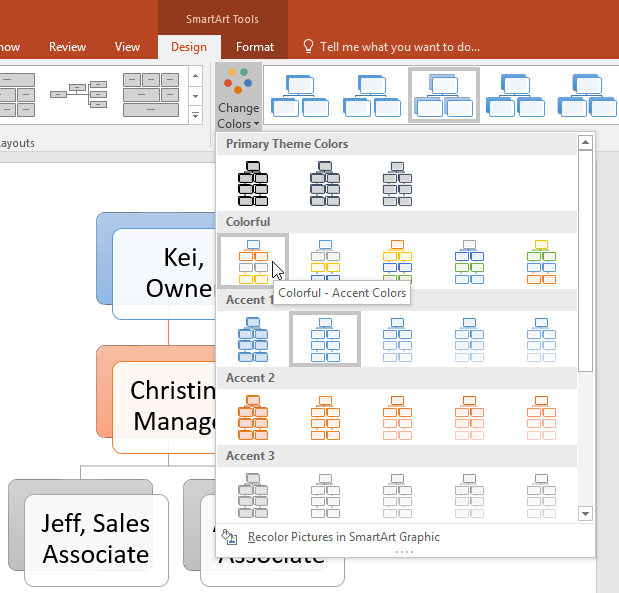
- You have a variety of color schemes to use with SmartArt. To change the colors, click the Change Colors command and choose the desired option from the drop-down menu.
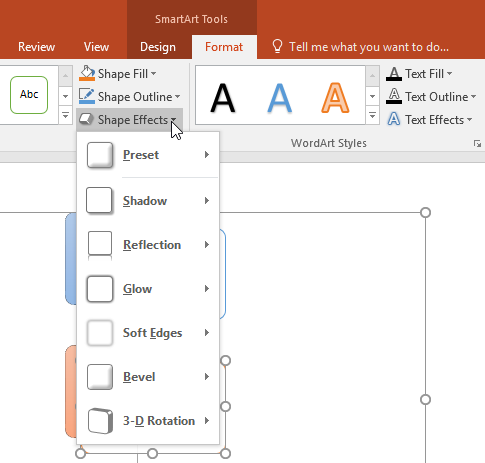
- You can also customize each shape independently. Just select any shape in the graphic, then choose the desired option from the Format tab.
SmartArt Category Suitability Chart
| SmartArt Category | Suitable Data Representation |
|---|---|
| List | Bullet points, sequential items |
| Process | Step-by-step processes |
| Cycle | Circular or recurring processes |
| Hierarchy | Organizational structures |
| Relationship | Connections between entities |
| Matrix | Interconnected relationships |
| Pyramid | Hierarchical or tiered structures |
Conclusion
The choice of the SmartArt category plays a pivotal role in transforming bullet points into visually impactful graphics. The “List” category stands out as an excellent option for creating informational graphics, providing a structured and visually appealing representation. By following the step-by-step guide and referring to the suitability chart, users can make informed decisions to elevate the visual presentation of their content in Microsoft PowerPoint.